


A multi-year study from researchers funded by the National Institute of Health has found that cannabis use in the United States increases during the final months of each year.
Published in the Drug and Alcohol Dependence journal, the study examined trends in cannabis use throughout the year and divides the year into four quarters.
- Quarter 1: January – March
- Quarter 2: April – June
- Quarter 3: July – September
- Quarter 4: October – December
Researchers used data obtained by the United States National Survey on Drug Use and Health (NSDUH). This is a large scale study that includes a cross-sectional sample of Americans across the country. Data from a total of 282,768 people aged 12+ was used and was collected through short computer-assisted interviews.
To ensure they were measuring seasonal trends for multiple years, researchers included five years worth of data, from 2015 to 2019. Researchers also focused on participants race, ethnicity, age, sex and education level, as they were looking to identify if seasonal trends in cannabis use were correlated with any particular demographics.
Participants were also asked if they had consumed cannabis in the past year and month, whether they met the criteria for Cannabis Use Disorder and if they used any other drugs.
The data showed researchers that cannabis use is gradually increasing across the country, but cannabis use still varies with each quarter. As you can see in the table below, cannabis use tends to be lowest during the first few months of the year. It then increases 13% from Quarter 1 to Quarter 4, before dropping off with the new year.
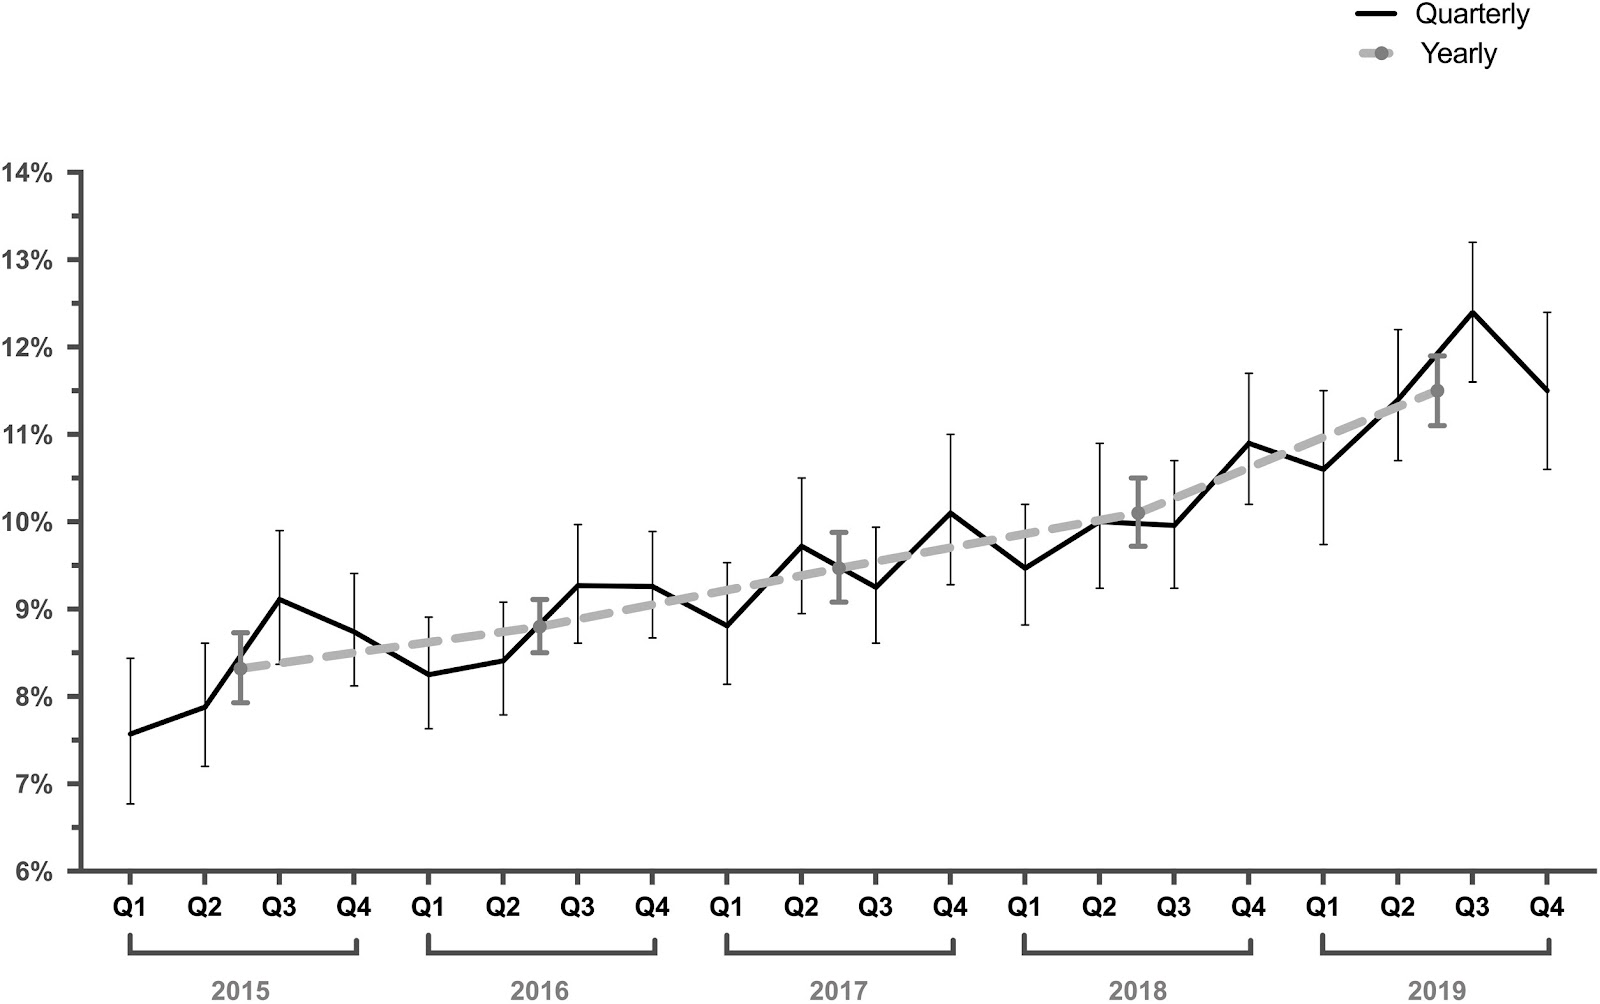
In total, researchers found that the rate of reported cannabis use increased by 38.2% over five years, from 8.3% in 2015 to 11.5% in 2019. However, the increase in cannabis was consistent across most subgroups of age, race, sex, and education. The only exception was people aged 65 and over, who reported a 52.7% increase in cannabis use.
In a news release published by New York University, researchers wrote:
We found that marijuana use is consistently higher among those surveyed later in the year, peaking during late fall or early winter before dropping at the beginning of the following year.
Can the same be said for Australia? Only time will tell.


